
Bike Ottawa is pleased to present our newest website feature: interactive maps. These were made possible through the work of the Bike Ottawa Data Group, and supported by councillor Jeff Leiper.
Councillor Leiper provided funding that equipped us with GPS cameras, powered meetings, and that will carry the web-hosting costs of this tool for years to come.
These maps will be a useful advocacy tool for Bike Ottawa, and will be a platform we will build on in the future. We invite you to check them out and offer us suggestions for improvement.
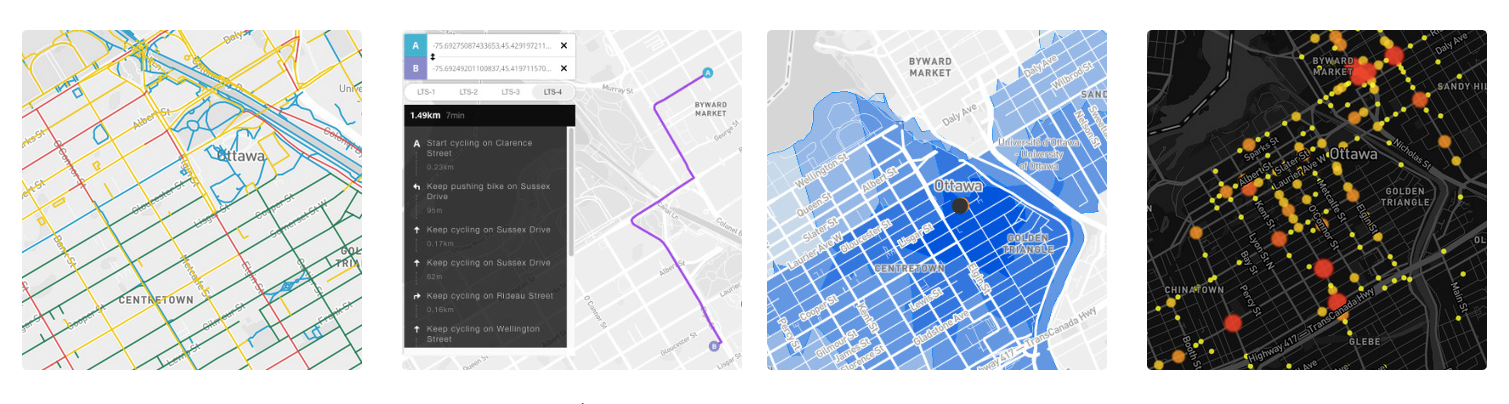
Level of Traffic Stress
Intuitively, we all know what traffic stress is. It’s the number one reason most people in Ottawa don’t ride a bicycle. For those of us who do ride, it’s what influences us to choose an indirect route, and to try to figure out the quietest streets to use. Traffic stress makes cycling feel dangerous and unpleasant. Factors that increase traffic stress are proximity to motor vehicles, traffic speed, traffic volume, and presence of on-street parking (doorings, unpredictable driving behavior). For every piece of road and path in Ottawa, we have calculated a “Level of Traffic Stress” rating from 1-4 based on the Mineta Institute formula. We’ve had to make some substitutions based on speed limit and class of road since we don’t have actual traffic speed, traffic volume, and roadway widths available to us (possible future open data datasets?). We also haven’t included intersections – that’s a complex calculation that we may tackle in a future edition.
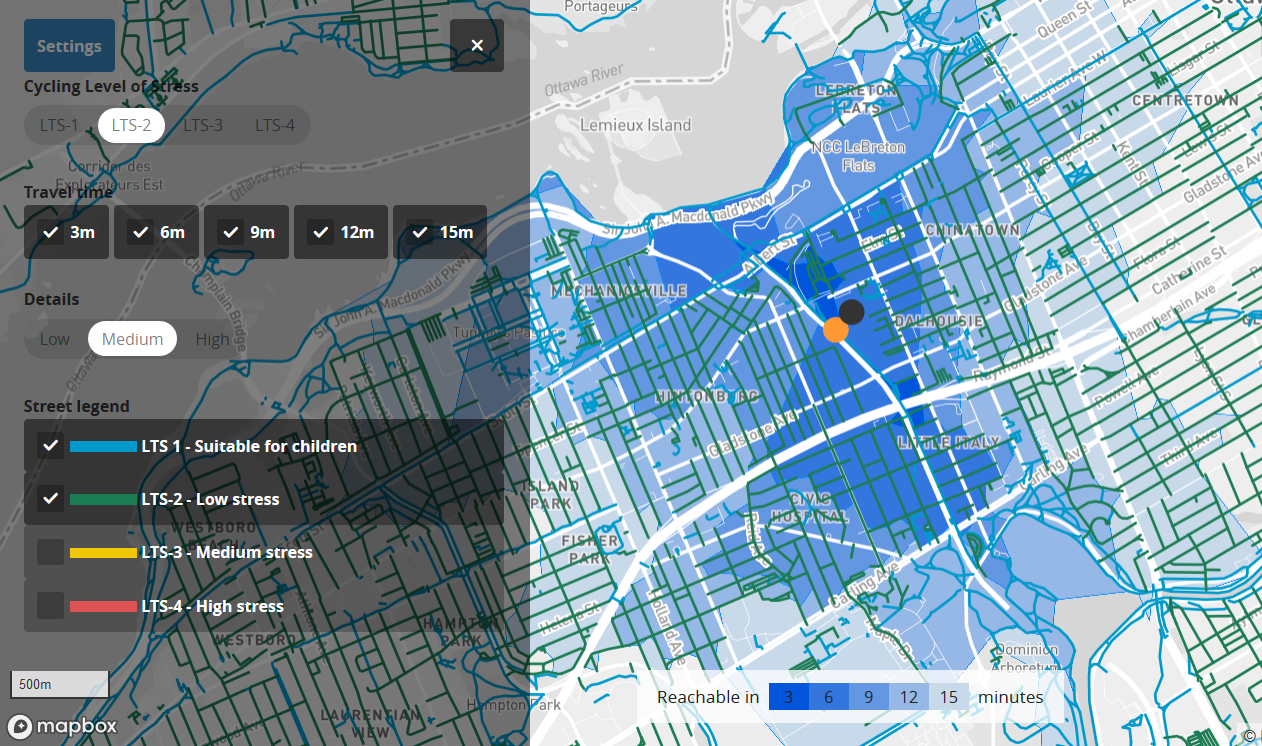
LTS 1 = suitable for unsupervised children
LTS2 = most adults willl be comfortable here
LTS 3 = adults who currently ride will use this
LTS 4 = very few people would be willing to ride a bicycle here
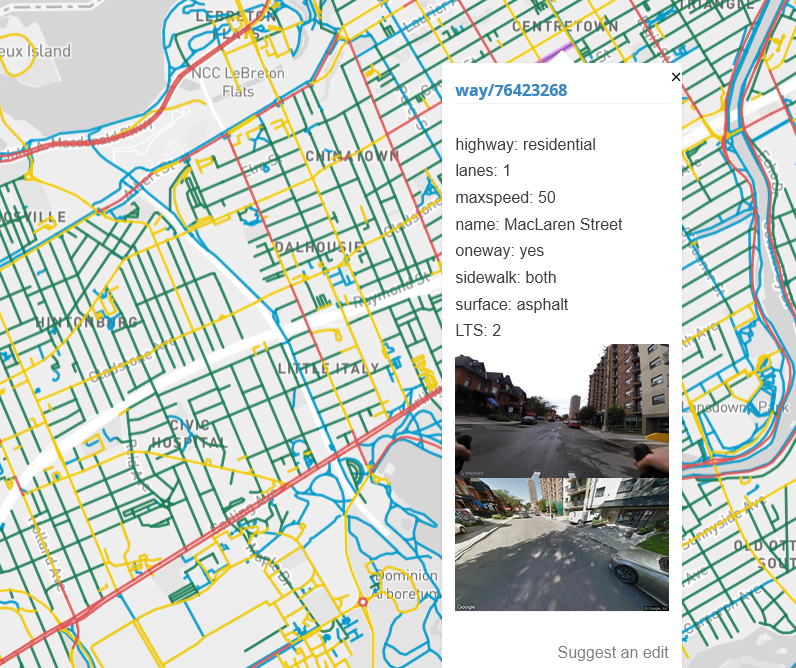
Please have a look and see if this matches the conditions you’re aware of (speed limit, bicycle infrastructure type). Click on the bicycle icon to bring up the layers you are interested in. If you think we’ve tagged something incorrectly, click on the road segment… that will bring up the tags for that “way”, and an opportunity to suggest an edit. If you’re keen, sign up for an account with Open Street Map and make the fix yourself using one of the editing tools (it’s easy, intutitive, and well-supported with online help).
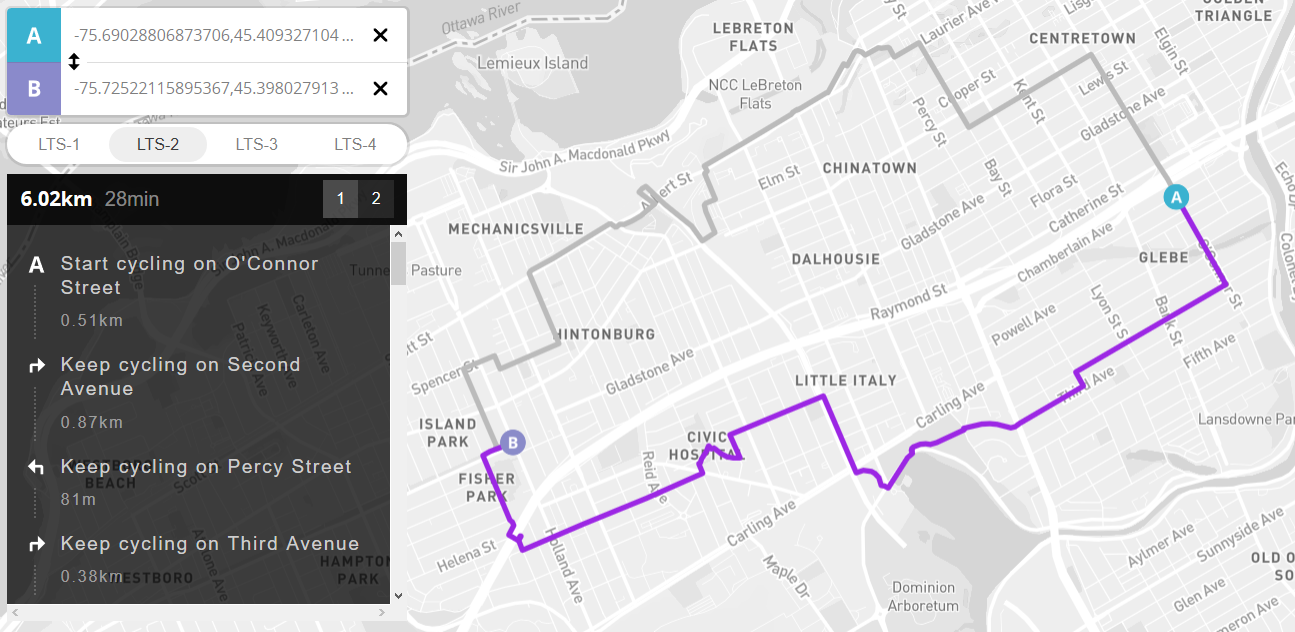
Routing
Building on our Level of Traffic Stress map, this interactive routing map will allow you to see if you can go from A to B on a route that doesn’t exceed your level of comfort. Of course, this can mean you’re in for some long detours. The routing engine assumes that you will not ever “walk your bike”, even if it means riding far out of your way. In an ideal world, the route for LTS 1 would not be much longer than the route for someone who is willing to ride absolutely anything. We currently see the routing engine as being most useful for identifying gaps in the cycling network, as we work towards making a connected low-stress network a reality.
Isochrones
Isochrone maps show you how far you can travel in a given amount of time. We’ve combined this with our underlying level of traffic stress map to show you how far you can travel from a point of origin without exceeding a specific level of traffic stress. It functions in the same way as the routing engine, but allows travel in all possible directions. Drag the black dot to your start point. If you can’t bike there given your preferred traffic stress level, the orange dot will follow and land on a point nearby. In settings, play with the LTS levels (white ovals) and LTS display (checkboxes) to customize your view.
Collisions
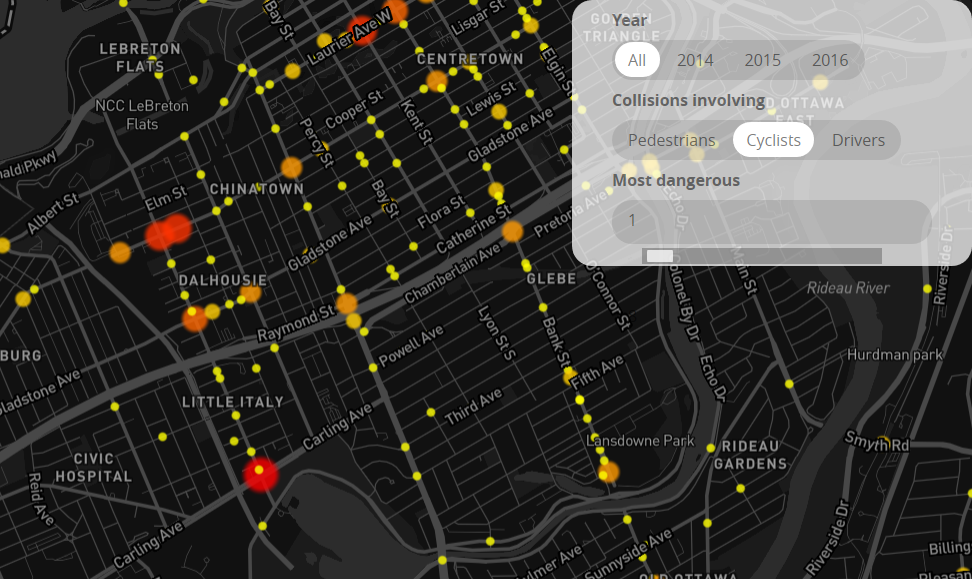
We’ve updated our collisions map to include information provided as City of Ottawa Open Data. Have a look at the map. These aren’t data we enjoy presenting, but where a police report indicates a cyclist or pedestrian injury, they can help to identify problems spots, with a view to improving conditions and preventing future collisions.